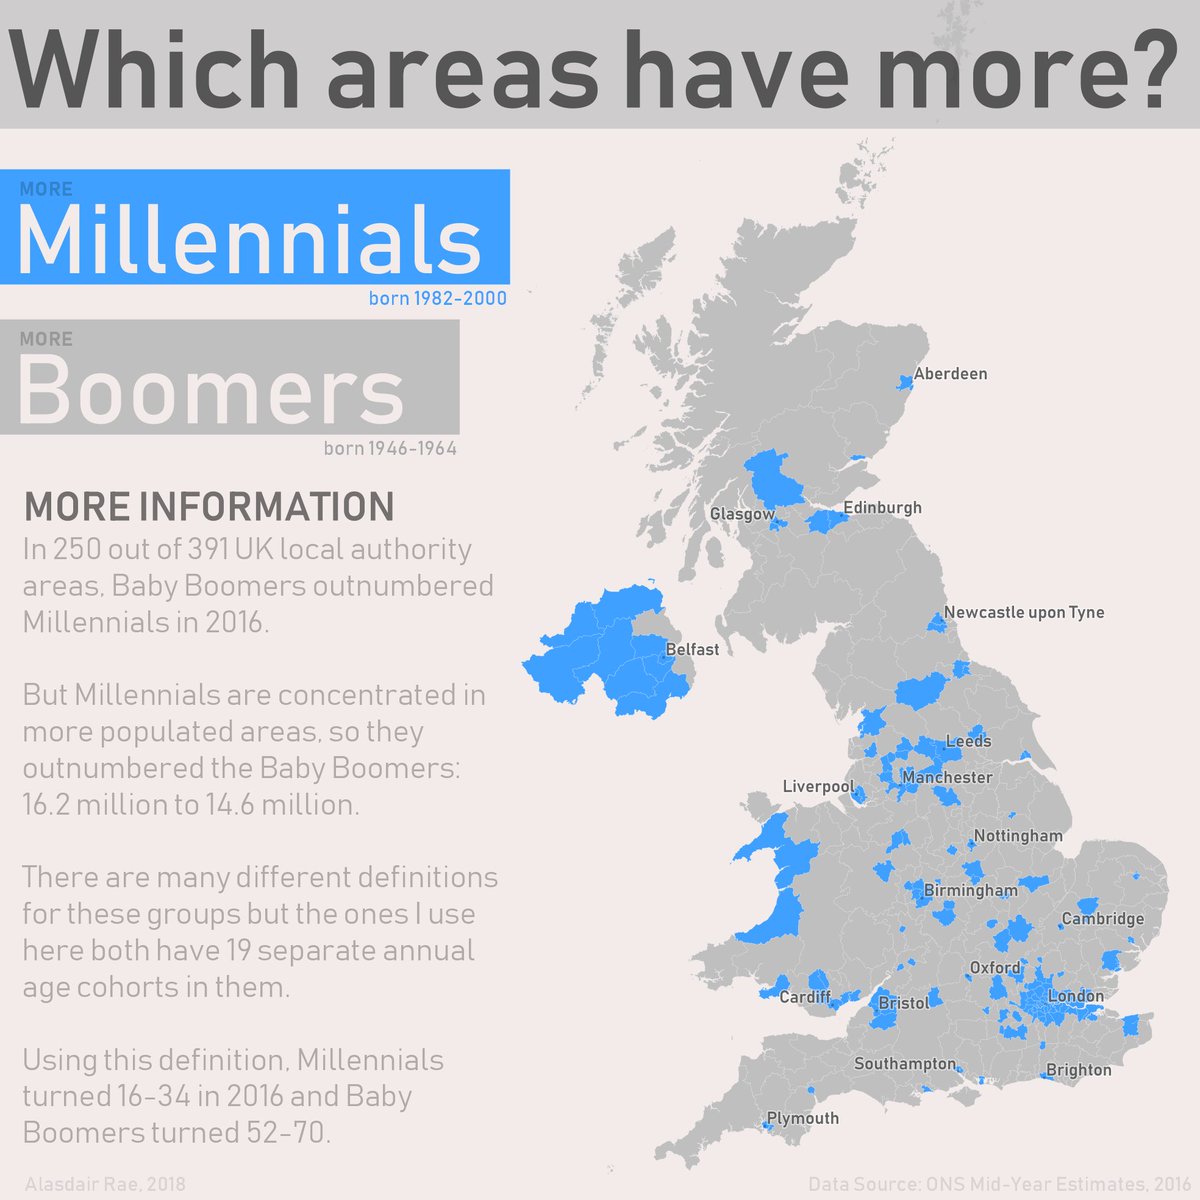
The map above shows which areas of the UK have more Millennials (defined here as those born between 1982-2000) living in them than Baby Boomers (those born between 1945-1964).
Surprisingly, Millennials now outnumber Boomers by quite a large margin 16.2 million vs 14.6 million.
Yet, because Millennials tend to cluster together more than Boomers, means 250 out of 391 local authority areas have a larger number of Boomers.
The Top 10 Millennial areas are (source):
- Tower Hamlets: 3.90X more Millennials than Boomers
- Islington: (2.94X)
- Hackney: (2.83X)
- Manchester: (2.82X)
- Oxford: (2.80X)
- Newham: (2.75X)
- Lambeth: (2.71X)
- Cambridge: (2.62X)
- Wandsworth: (2.57X)
- Nottingham: (2.41X)
Interestingly, 6 of the top 10 are in London, with the University towns of Oxford and Cambridge also making the list.
Top 10 Boomer areas are (source):
- West Somerset: 2X more Boomers than Millennials
- South Hams: (1.89X)
- Rother: (1.85X)
- West Dorset: (1.85X)
- North Norfolk: (1.85X)
- West Devon: (1.82X)
- East Dorest: (1.82X)
- Derbyshire Dales: (1.79X)
- East Lindsey: (1.75X)
- South Lakeland: (1.72X)
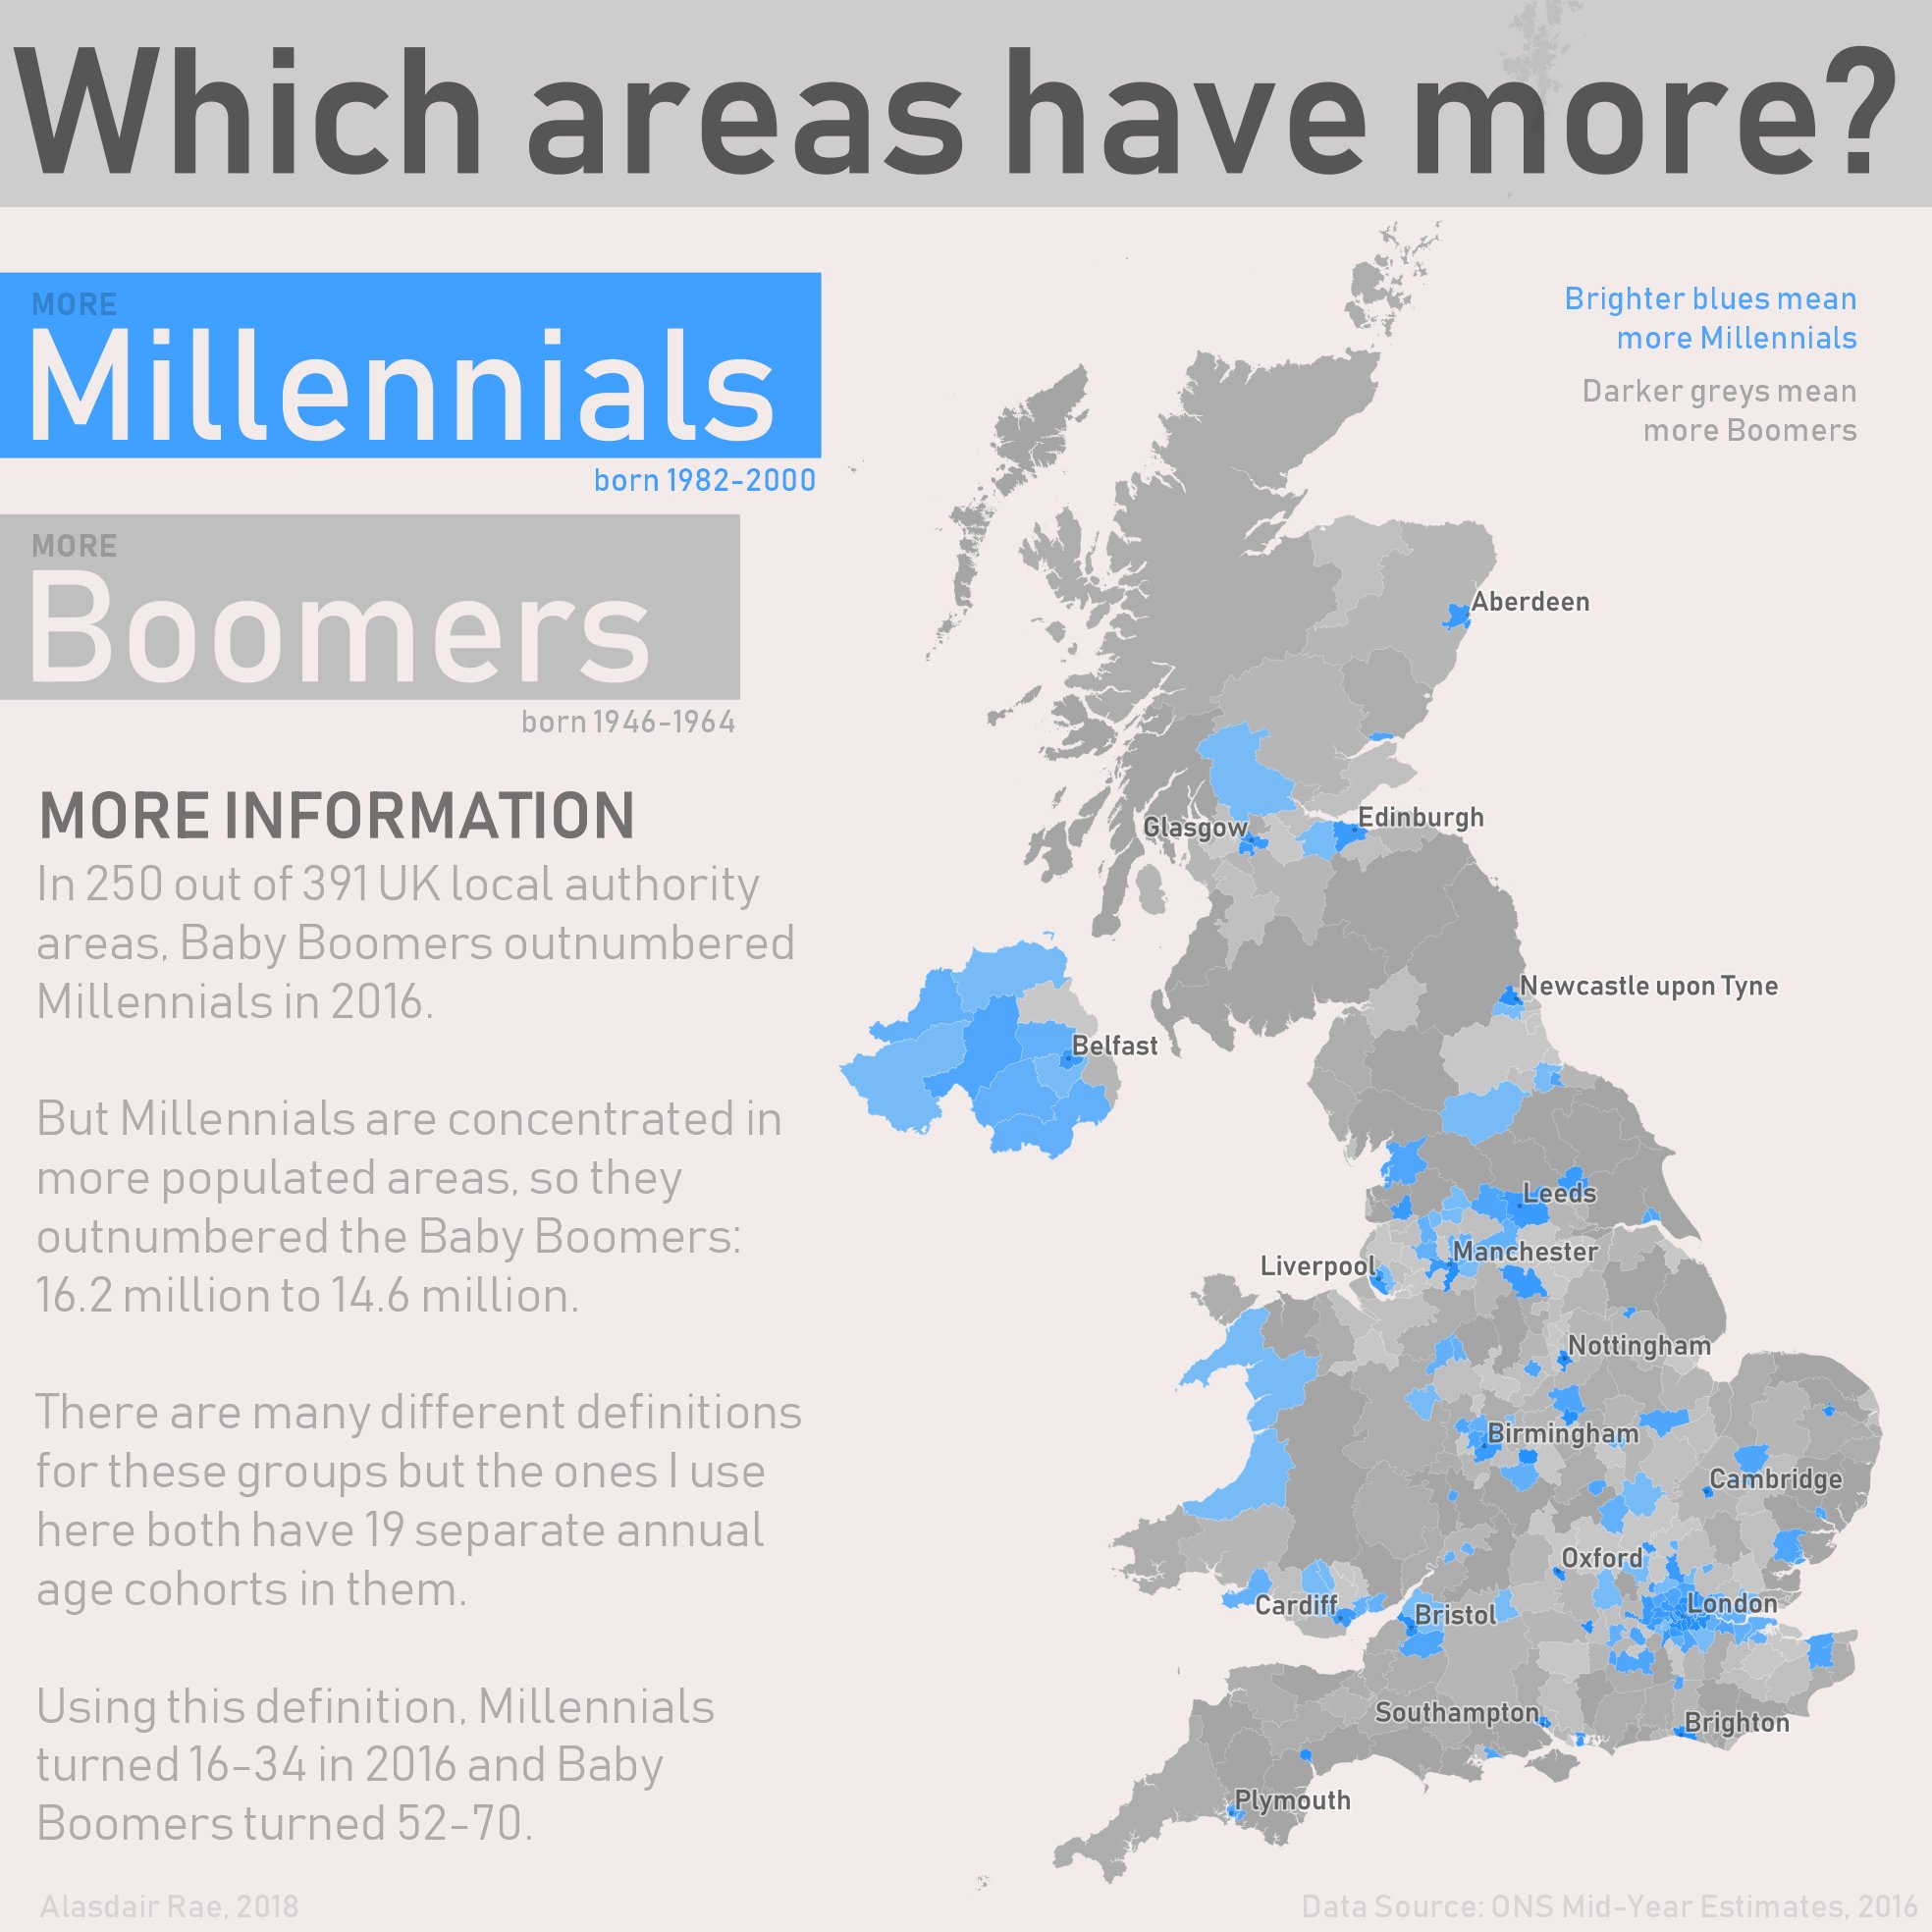
To get a better idea of where Millennials are concentrated, Alasdair also created a scaled version of the map. Brighter blue means more Millennials and darker grey means more Boomers.
Data for the above came from the ONS.
You can follow Alasdair on twitter at @undertheraedar
Leave a Reply