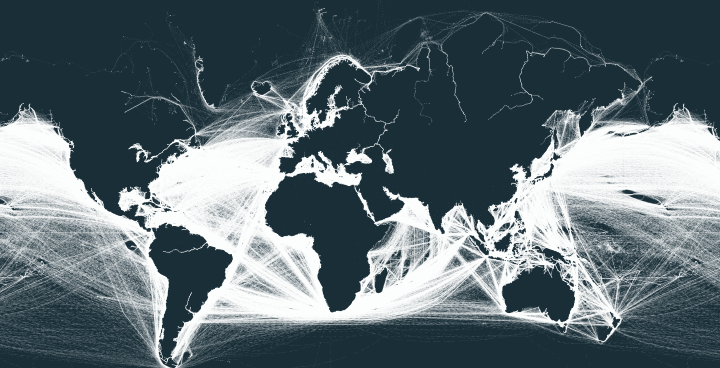
With a few notable exceptions, The map above shows the outline of the world’s continents simply by visualizing shipping routes.
The map was created by reddit user mattsdfgh who stiched together screenshots from KILN‘s ShipMap.org. All the data is from 2012.
You can see the full time lapsed map of the movement of ships in the map below:
Created by London-based data visualisation studio Kiln and the UCL Energy Institute
As you can see the map above also includes lots of other interesting data such as CO2 production, dry weight, liquid weight, gas, vehicles and of course containers.
To learn more see: International Container Shipping
If you like this map, please help us by sharing it:
micheljohn says
The continent information looks very good, and it has helped me a lot, and would recommend you to read this article.